
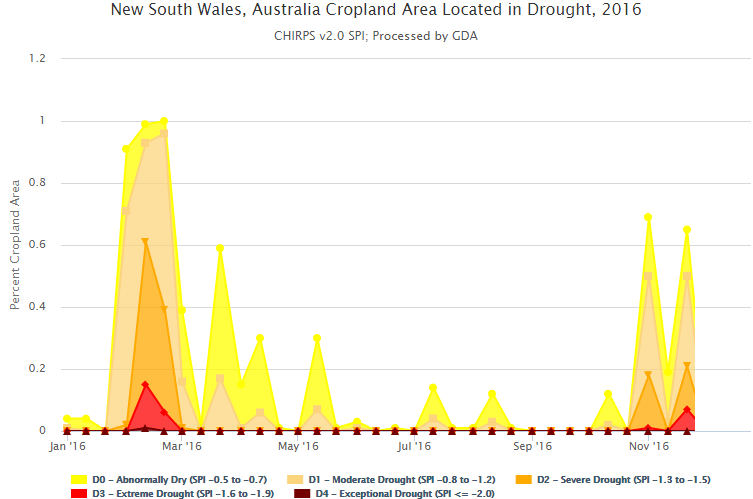
To the aggregated CHIRPS weather data under the Weather Topic, we have added new variable calculations that show the percent of cropland pixels whose aggregated SPI falls into each item of a set of drought conditions for each administrative unit location and temporal period.
- >= 1.5
- 0.5 to 1.5
- Average (SPI -0.5 to 0.5)
- D0 – Abnormally Dry (SPI -0.5 to -0.7)
- D1 – Moderate Drought (SPI -0.8 to -1.2)
- D2 – Severe Drought (SPI -1.3 to -1.5)
- D3 – Extreme Drought (SPI -1.6 to -1.9)
- D4 – Exceptional Drought (SPI <= -2.0)