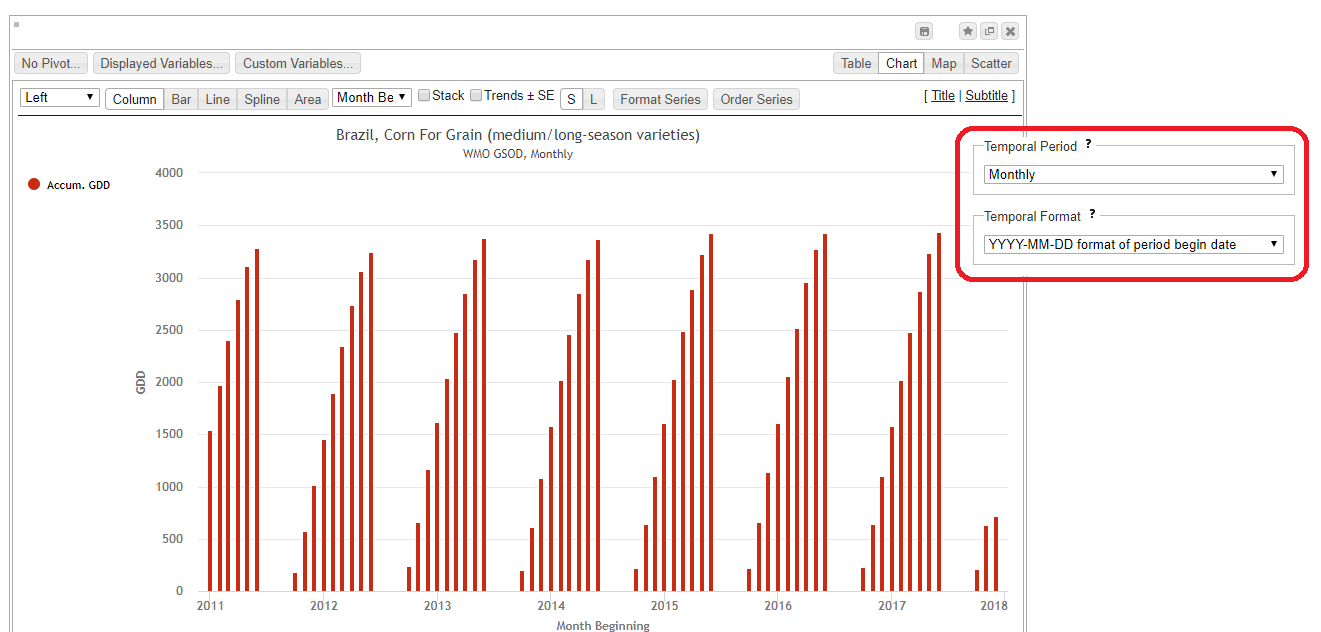
We have expanded the Weather Topic so that users can choose the type of temporal format to be used in a widget. Previously, only the full start date of the period (dekad, week, month) could be selected in YYYY-MM-DD format (this is still the supported default and existing dashboard widgets will not be effected). This format allows data to be charted sequentially in temporal format, e.g. this screenshot.
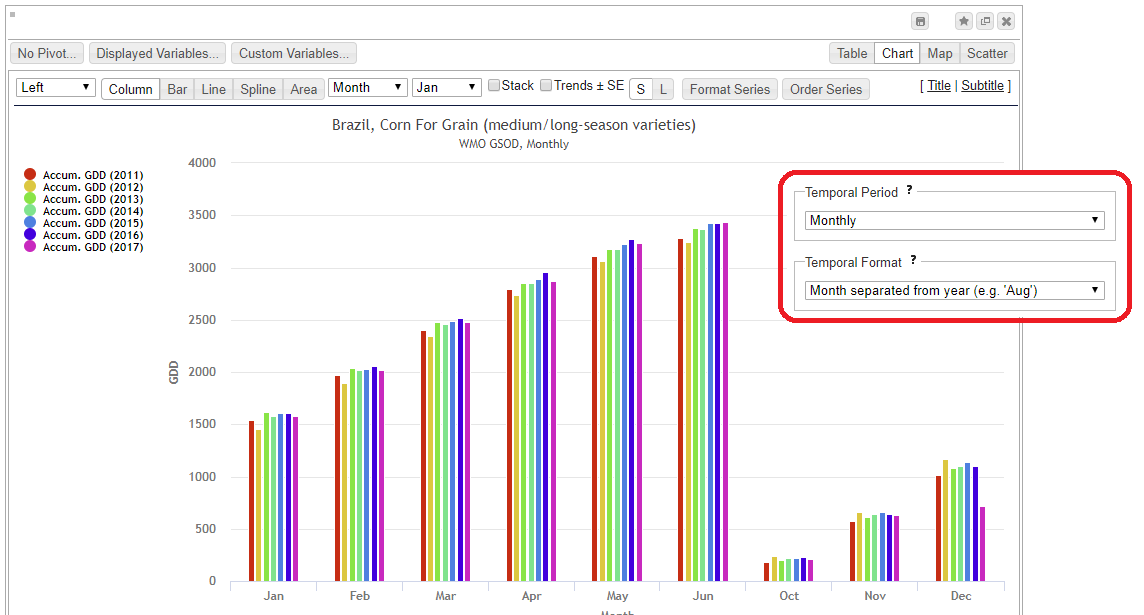
However, this format will not allow you to make easy year-over-year comparisons. To that end, we have added a “Temporal Format” dropdown in the topic settings (similar to that on the Annual Crop Stats topic), that allows you to choose a format that doesn’t include the year which makes year-over-year charts feasible, e.g. this screenshot.
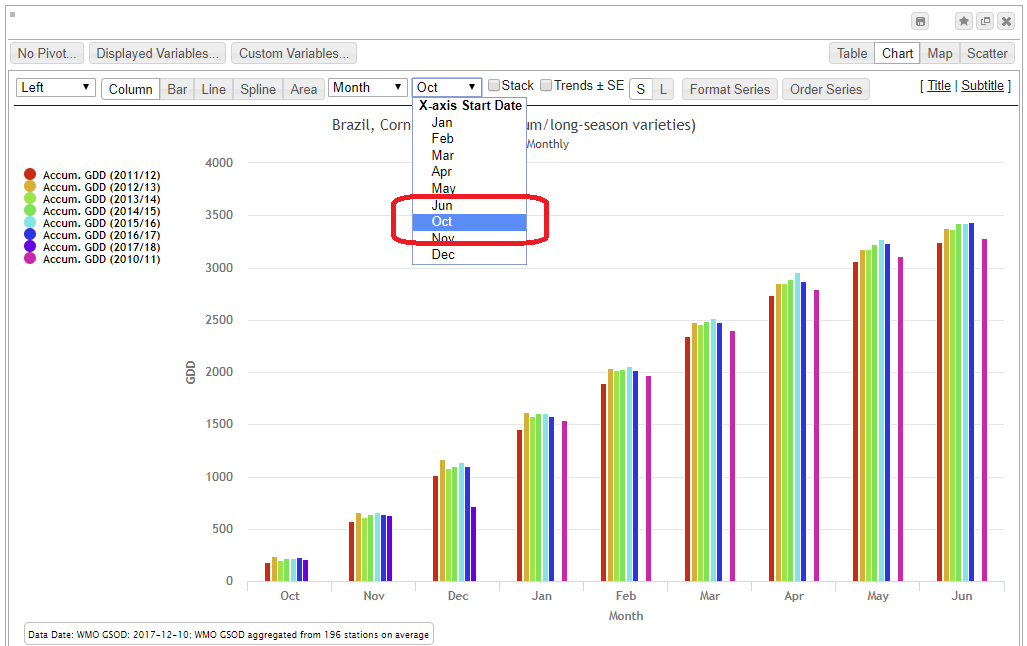
By default, the data will be displayed over a calendar year x-axis from January to December. However, depending on the data and locations being charted, it may be better to adjust the x-axis to start on a different date on the chart. For this, we have added a dropdown on the chart widget toolbar that allows you to pick the date to begin the x-axis, e.g. this screenshot.