
We have revised the way GDD-derived crop stages are labeled as plotbands on crop-specific GDD charts from the Weather Topic. If only one year, location, and crop are selected, the GDD stages are displayed along the X-axis (time). If more than one location or year are selected than the GDD stages appear as plotbands on the Y-axis as before.
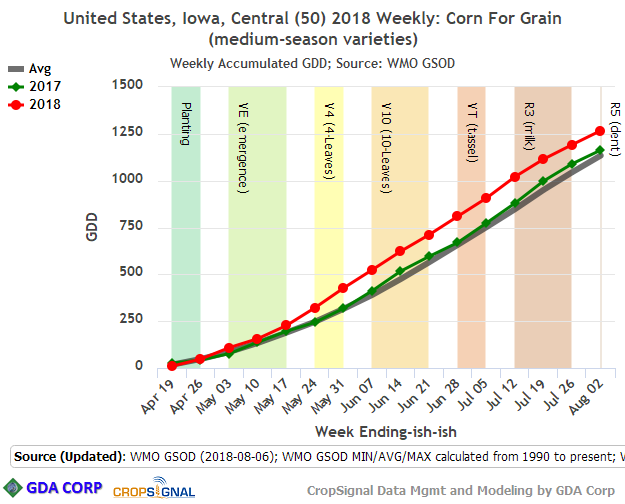
To build such a chart: Navigate to Weather topic, select a location and year. Make sure to select a specific crop (not ‘Non-crop-specific weather’), the appropriate months, the WMO GSOD source and either Accum GDD or Accum Precipitation (or both) from the variables dropdown under the ‘Crop specific variables’ header. If using a Monthly temporal period, make sure the Temporal Format is ‘Month separated from year’. If using a Weekly temporal period, make sure to use the Temporal Format ‘Week Ending Date (approx) separated from year.