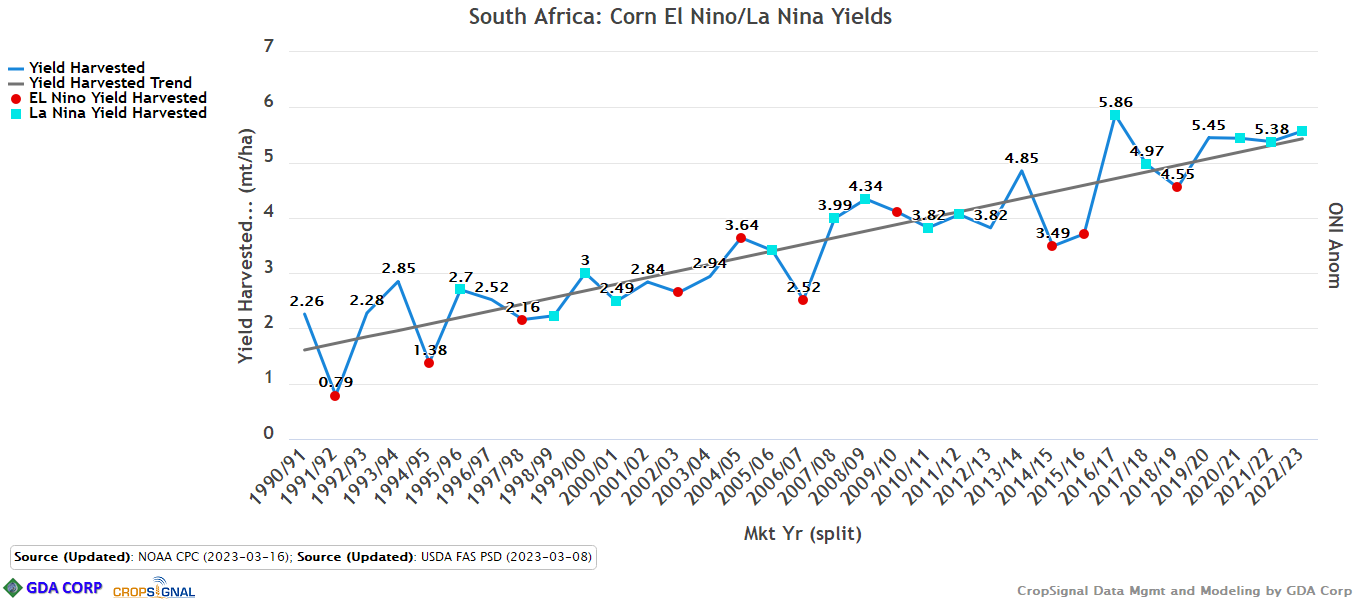
These charts can be created under the Annual Crop Stats topic.
Choose:
- One location
- One crop
- One source
- One variable (e.g. Yield)
- The desired years — make sure to change to USDA Market Year Split
Expand the Widget Types and Options area, uncheck ‘Pivot’ and check ‘ONI Chart’ to generate charts like those below