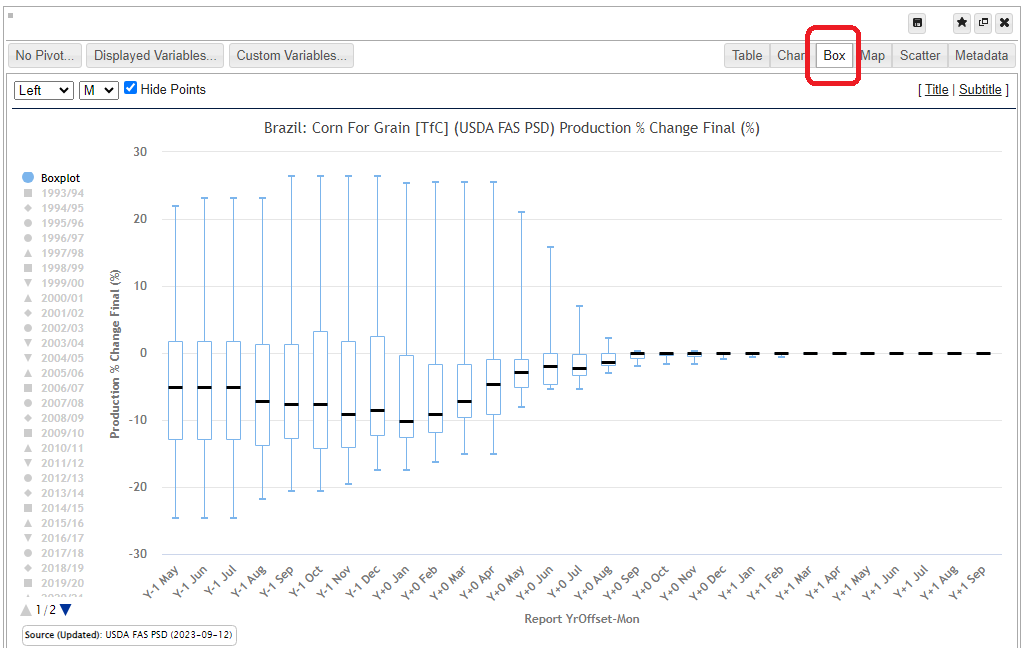
A new boxplot chart type has been added to pivot widgets on the Annual Crop Stats Topic. The boxplot groups the y-axis data points for each x-axis point and groups them into a ‘box’ with whiskers for the low and high value, a black line for the median value and the box outline at the 1st Quartile and 3rd Quartile points. Use the ‘Box’ button on the pivot widget type menu. You can flip to the ‘Chart’ mode to use the chart formatting features (they are shared with the Box type). You can hide/show the data points inside the boxes with the ‘Hide Points’ checkbox in the widget toolbar.