
The Y-axis labels on the Annual/Monthly Crop Stats topics have been slightly revised so that the variable is listed first, followed by the unit in parenthesis.
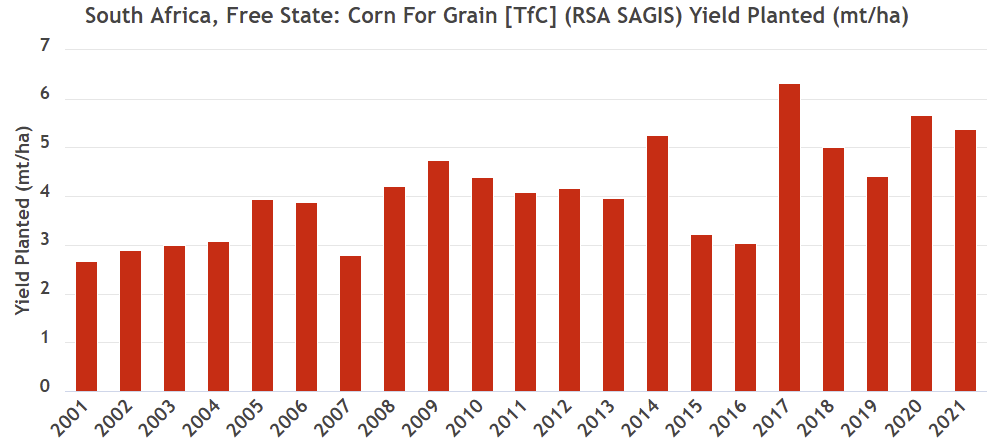
The Y-axis labels on the Annual/Monthly Crop Stats topics have been slightly revised so that the variable is listed first, followed by the unit in parenthesis.
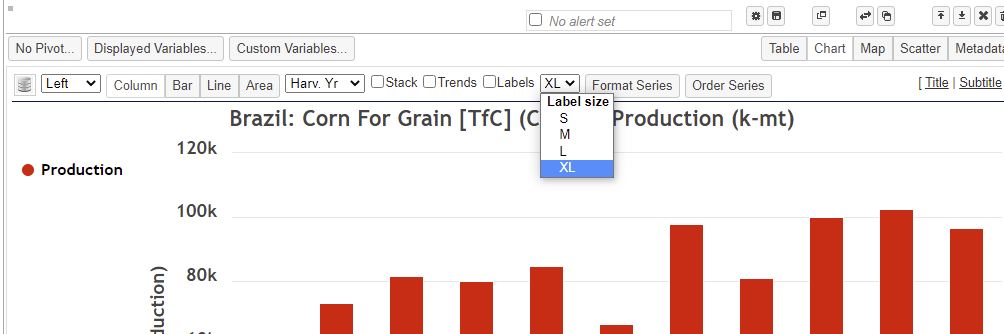
A new Extra-Large label size option has been added to Charts and Maps. The label size selector has been changed to a dropdown. Note that both the label size and the overall chart size can both be controlled and the relative size of labels can be affected by the widget size as well.
If you scroll down on the home page, you will see the Recently Updated Stats widget that lists recently updated datasets. It previously only showed data from the Annual Crop Stats Topic, but now it includes updates from Progress/Condition and Monthly datasets. If you click on the source name, you can quickly see some widgets that preview a subset of the data included in that update.
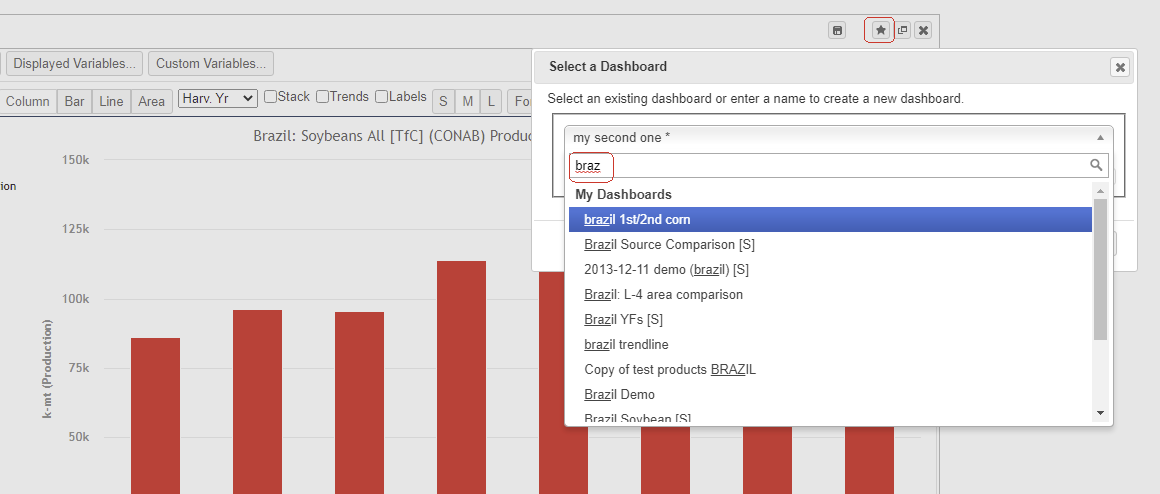
You can now search by keyword when selecting an existing dashboard to save a widget on. After you click the Star icon, a modal dialog appears where you can either select an existing dashboard or enter the name of a new dashboard. When you expand the dropdown containing your list of dashboards, there is a text-box you can use to filter your list of dashboards to quickly find a specific dashboard.
If you scroll down on this home page, you will find a new widget that contains an embedded preview of side-by-side GeoChronicles Bookmarks on GeoSynergy2!
If you scroll down on the home page, you will see a new widget that lists recently updated datasets (from the Annual Crop Stats topic only). If you click on the source name, you can quickly see some widgets that preview a subset of the data included in that update.
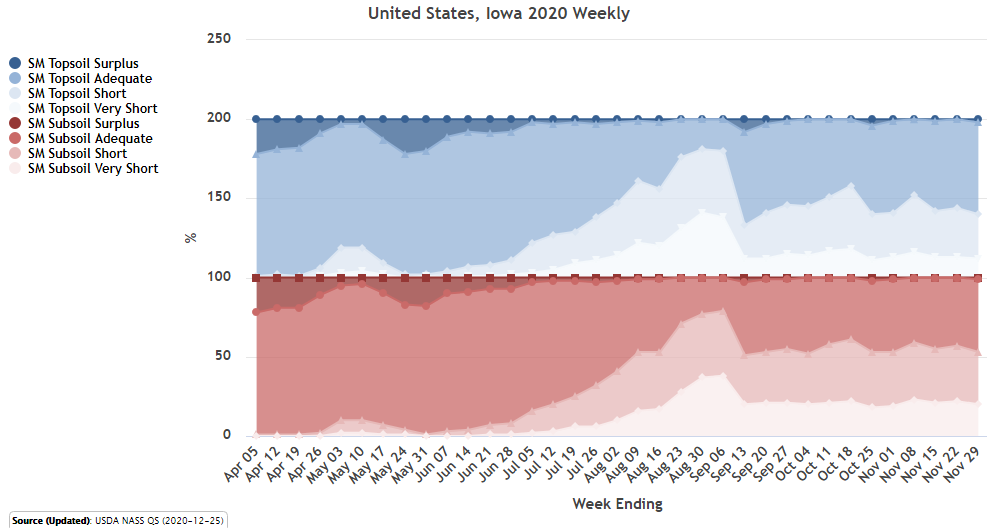
The weekly Topsoil/Subsoil classification statistics have been added to CropSignal. The data is sourced from NASS QuickStats and covers US National and State levels from 1995-present. The data can be found from the CropSignal Weather topic (Use ‘Non crop specific weather’ as crop), from the USDA source.
To improve the rendering performance of CropSignal Dashboards, we have added pre-rendered caching to some map widgets from the Annual Crop Stats Topic. Dashboards that have been created or viewed in the last 60 days will have the map images rendered in advance so they should load much faster when viewing. Keep logging into CropSignal and viewing your favorite dashboards so they continue to perform optimally!
The help section has been revised. A table of help topics and FAQs is now available with easy-to-navigate carousel of screenshots and tips along with broken down video tutorials.
Also, the Annual Crop Stats Topic now has a self-guided tour option.
You can now pin the previews of webmarks to dashboards as individual widgets. Navigate to the Webmarks tab and click the “Preview” link for any of your webmarks (or those that have been shared with you), and the preview widget will appear in the box to the right. Click the little star at the top-right of the widget and pick the dashboard to pin the webmark to. (Note: Some webmarks may not permit previews inside CropSignal).