New! Save GeoChronicles Bookmark widgets to Dashboards

You can now save GeoChronicles Bookmarks widgets to CropSignal dashboards. The GB widget preview on the CropSignal home page can be saved to a dashboard.

Or, if you go to Tools -> GeoChronicles Bookmarks and click the Preview link for a bookmark, you can save that preview widget to a dashboard.

The widget will update itself during the season following the monthly schedule.

Posted in Uncategorized | Leave a comment

New! Axes Editor

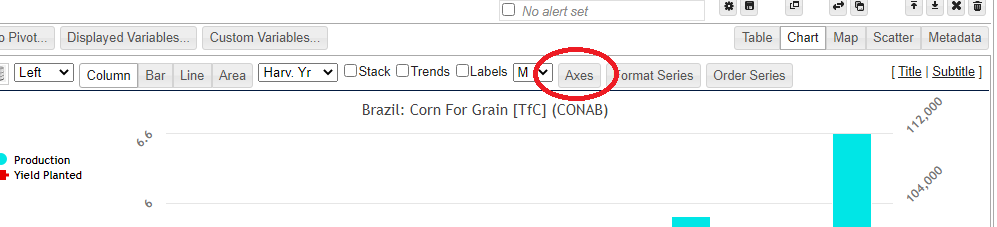
We have added a chart axes editor feature to pivot charts. You can now find an ‘Axes’ button on the chart toolbar of pivot charts.

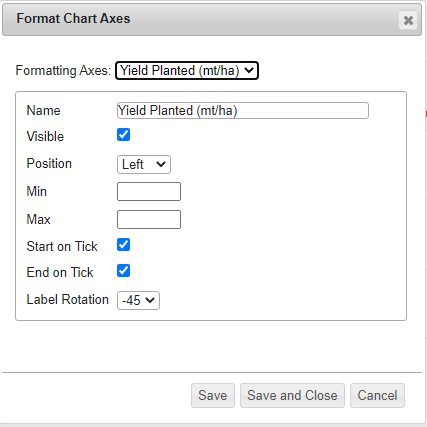
This will open a dialog box that contains a selector at the top where you can cycle through all y-axis and the x-axis, each of which can be configured including the name, visibility, left/right position, min/max value, start/end on Tick and label rotation.

Posted in Uncategorized | Leave a comment

Dashboard/Webmark Sharing Updated

The sharing controls for dashboards and webmarks have been revised to provide more clarity about the given permissions, especially for when augmenting existing permissions. Additionally, edit/resharing privileges can now be assigned on a per-user/group basis.

Posted in Uncategorized | Leave a comment

Revised Chart Series Formatter

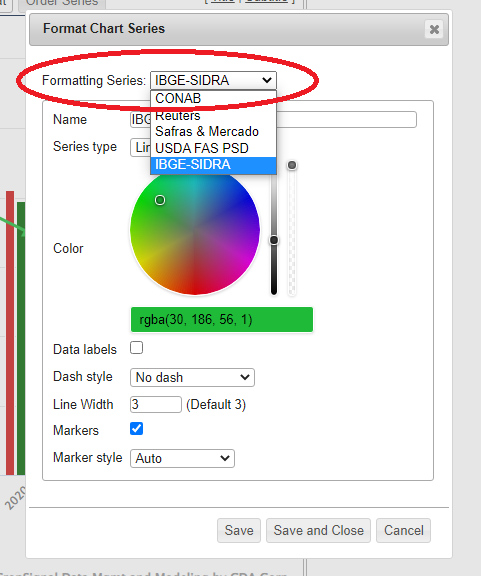
We’ve revised the chart series formatter tool to support speedy changes to multiple series. Once you’ve opened the series formatter (by clicking ‘Format Series’ button and selecting a series to edit), the format series dialog box now has a dropdown where you can easily jump to another series to edit.

You just need to remember to Save your changes before switching to a new series to format.

Posted in Uncategorized | Leave a comment

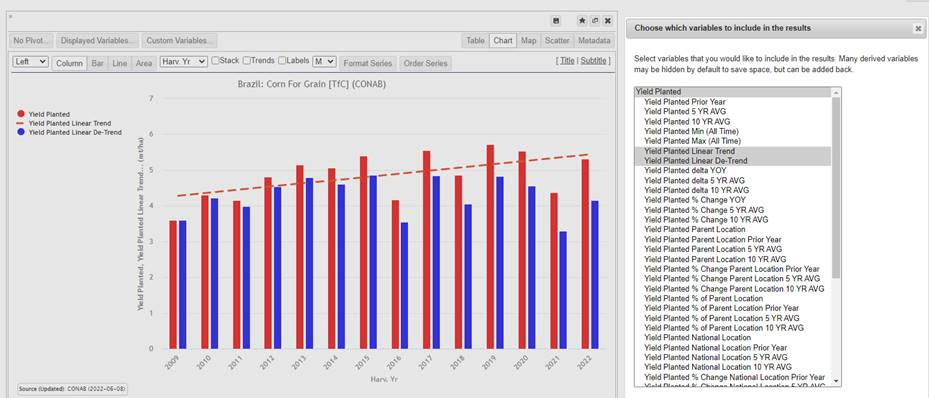
Linear Trend/Detrend Displayed Variables

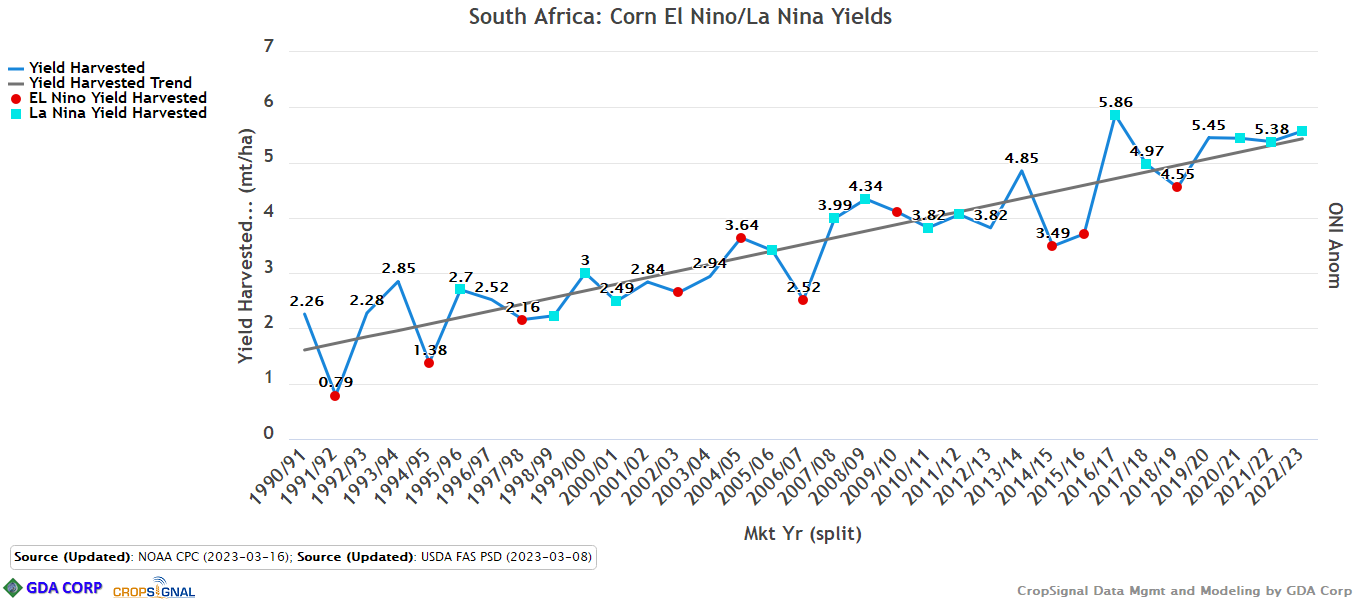
Linear trend and de-trend variables are now available in the Annual Crop Stats topic as available variables under the “Displayed Variables…” dialog box on pivot widgets. Click “Displayed Variables…”, and then hold Ctrl and select Linear Trend and/or Linear Detrend to add those variables to your pivot widget.

The trend period is based on the sequence of years that are included in the widget.

Posted in Uncategorized | Leave a comment

New Feature! Join Widgets from separate topics

A new beta feature has been added to CropSignal that allows widgets from different topics to be merged into a single widget.*

Click here to see PowerPoint demo.

Click here to see YouTube demo.

*Only widgets from certain topics and years/dates must be formatted similarly for join to work successfully.

Posted in Uncategorized | Leave a comment

Variable unit scale prefix revised

Variable unit scale has been revised to explicitly list the numeric scale rather than the SI prefix. E.g., “k-ha” is now “1,000 ha”.

Posted in Uncategorized | Leave a comment

Y-axis revised

The Y-axis labels on the Annual/Monthly Crop Stats topics have been slightly revised so that the variable is listed first, followed by the unit in parenthesis.

Posted in Uncategorized | Leave a comment

XL Chart Label Size added

A new Extra-Large label size option has been added to Charts and Maps. The label size selector has been changed to a dropdown. Note that both the label size and the overall chart size can both be controlled and the relative size of labels can be affected by the widget size as well.

Posted in Uncategorized | Leave a comment

Recent Stats Updates includes Progress/Condition and Monthly

If you scroll down on the home page, you will see the Recently Updated Stats widget that lists recently updated datasets. It previously only showed data from the Annual Crop Stats Topic, but now it includes updates from Progress/Condition and Monthly datasets. If you click on the source name, you can quickly see some widgets that preview a subset of the data included in that update.

Posted in Uncategorized | Leave a comment