The Alerts tab has now been split into two subtools: Widget Alerts (previous alerts tool) and PSD Alerts. The new PSD Alerts tool shows all recent PSD statistics compared with those from other national sources. When Area or Production values from PSD deviate more than 10% from a national source this triggers an alert.
Users can control the trigger threshold, which locations/sources should be monitored and specific country/crop/years can have specific trigger thresholds, be dismissed or disabled.
Check out the new tool where you can construct estimates for the upcoming market year for a given country/crop. See the October showcase video for a demo.
The “Advance Estimates”, “All India Crop Situation”, “Weekly Crop Weather Watch” and “NFSM Area Coverage Dashboard” reports from India have been updated to reflect changes in the India DAC websites. The PDFs/pages are indexed and searchable in the Reports Topic.
Monthly cotton arrivals data from India Textile Ministry has been added to the Crop Progress/Annual Crop Stats Topic. Data is stored as Production and converted using 170kg/bale unit.
We have updated the Lockup Tables to include a font size options to allow analysts to shrink the font size in exported Lockup Table documents (and an ‘auto’ option that chooses the best size based on available sources).
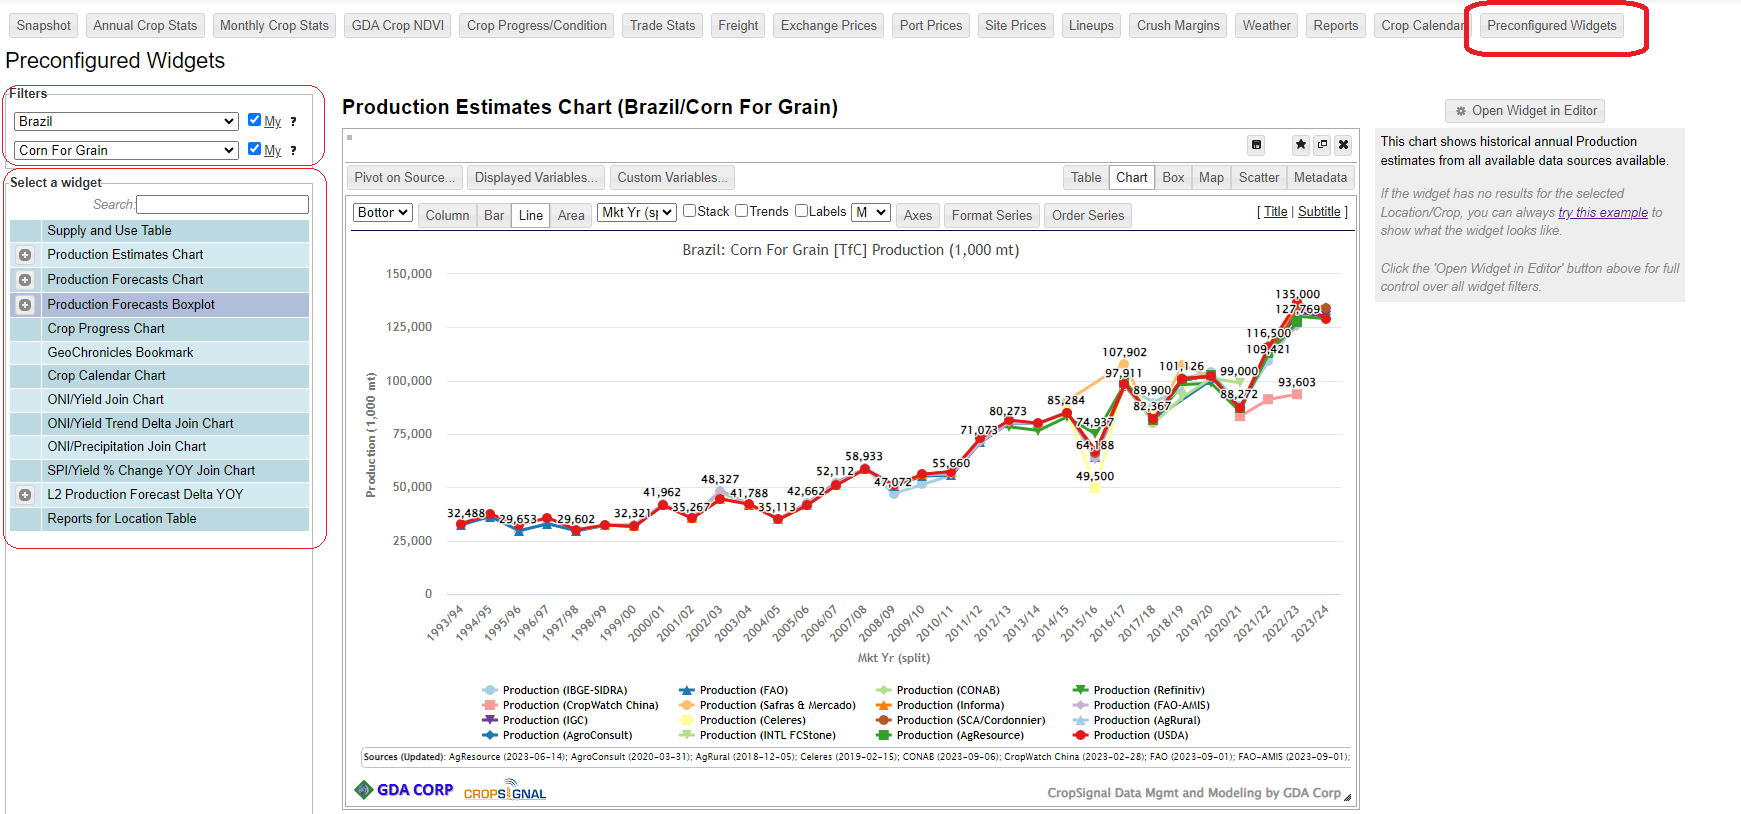
We have added a new Topic titled Preconfigured Widgets. You can find it in the Topics menu. The goals of this topic were:
Make it easy to find a specific commonly used widgets (including complex joins types that follow predefined structure/format) all in one place
Make it easy to see “situation” for specific country/crop in one place – e.g. you pick country/crop then you can click through available widgets to see data for it (if data is available)
Create customized editors for each widget where only relevant selections are required.
A simple entry point for CropSignal that requires only three clicks to generate a widget
Simply choose a country and a crop from the filter list, then choose a widget from the table below to visualize it. Unclick the “My” checkboxes to expand country/crop lists to the full lists (country/crops are limited to those covered by PS&D data). To apply widget to different filters (e.g. subnational data), click the ‘Open Widget in Editor’ button for expanded filters for the widget.
Please try it out and give us any feedback including any requests for new widget types to be added there!
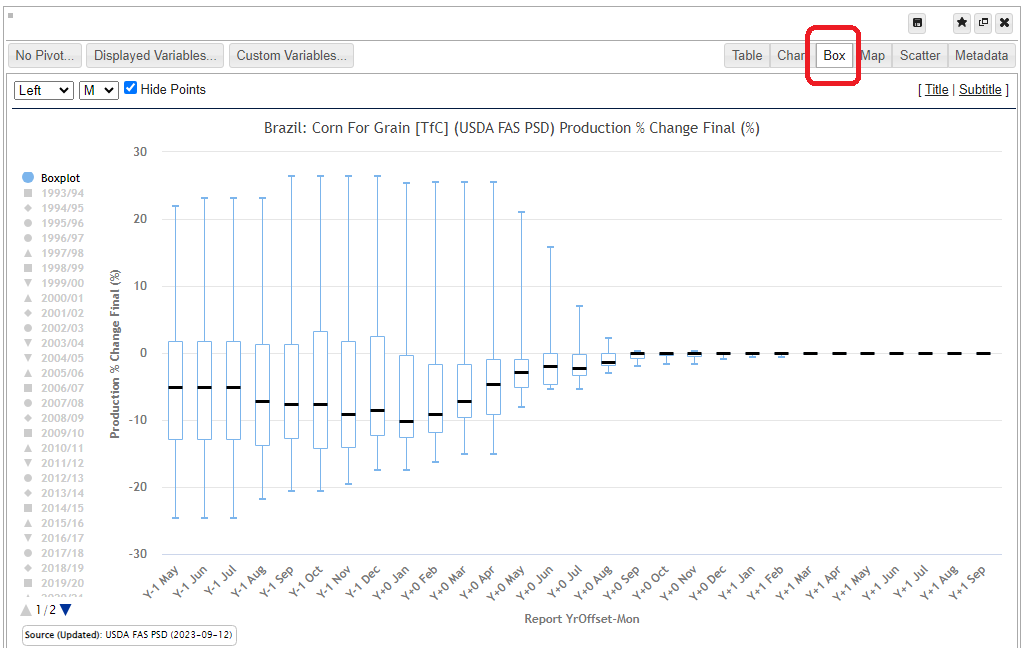
A new boxplot chart type has been added to pivot widgets on the Annual Crop Stats Topic. The boxplot groups the y-axis data points for each x-axis point and groups them into a ‘box’ with whiskers for the low and high value, a black line for the median value and the box outline at the 1st Quartile and 3rd Quartile points. Use the ‘Box’ button on the pivot widget type menu. You can flip to the ‘Chart’ mode to use the chart formatting features (they are shared with the Box type). You can hide/show the data points inside the boxes with the ‘Hide Points’ checkbox in the widget toolbar.
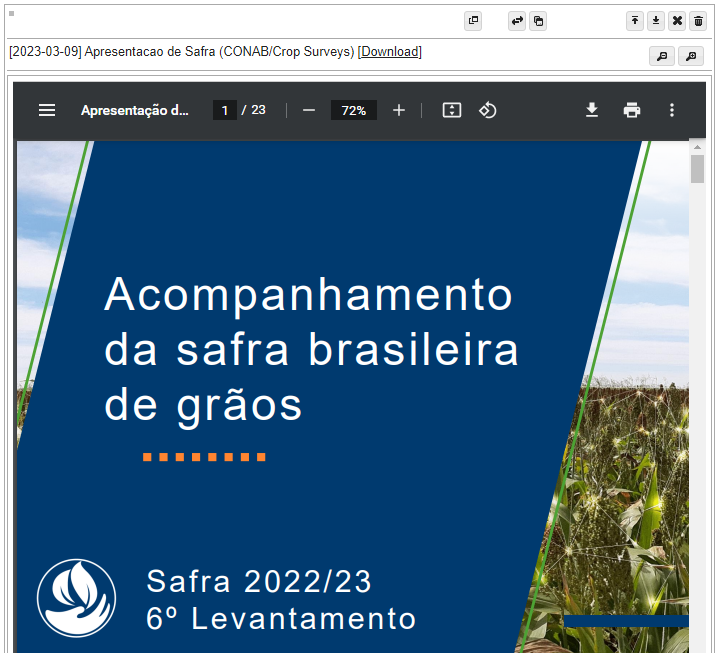
You can now view indexed report contents (of web visible types, e.g. PDF, HTML, text) in embeddable widgets. In a reports index table, generated from the Reports topic, you can preview a report’s contents in a popup widget by clicking the Preview widget. The widget preview can be saved to dashboards as well.