Dashboards can be manually ordered

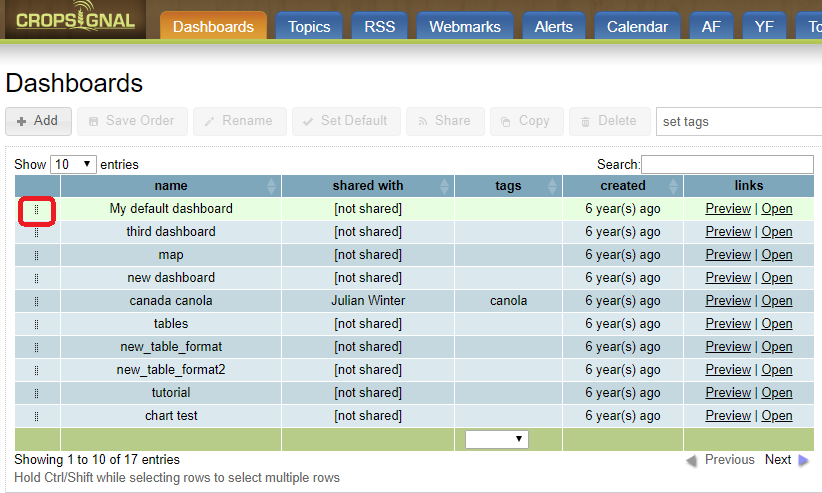
Dashboards can now be manually ordered from the index page.  You can click the little “grab” icon in the first column and drag-and-drop dashboards into the desired order.  Once completed, make sure you click the ‘Save Order’ button to preserve the order on your account.  You can also sort the dashboards by the columns in the table (e.g. name, created), but if you do that, you cannot manually re-order the columns without refreshing the page.

Posted in Uncategorized | Leave a comment

New NDVI-derived “Condition Variables”

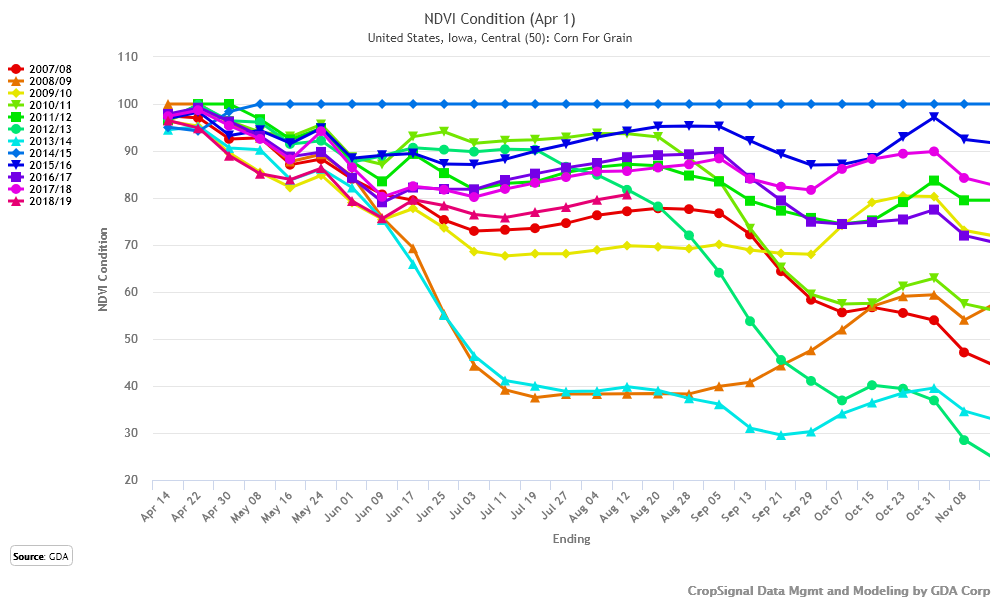
We have added new variables that estimate relative crop conditions using crop-specific MODIS NDVI data.  The variables utilize historical accumulated NDVI (from a given start date) to estimate the relative condition between years over time.

The variables are available under the “GDA Crop NDVI” topic as “NDVI Condition” variables.  Twelve variables exist, one for each accumulation start month.  We suggest using the “MM-DD (approx)” temporal format setting to see the data year-over-year.

The methodology can be found here.

Posted in Uncategorized | Leave a comment

GDD-derived time stages in Weather Topic

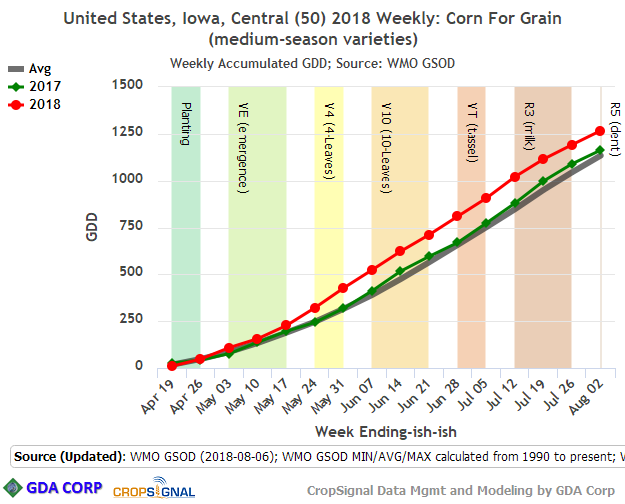
We have revised the way GDD-derived crop stages are labeled as plotbands on crop-specific GDD charts from the Weather Topic.  If only one year, location, and crop are selected, the GDD stages are displayed along the X-axis (time).  If more than one location or year are selected than the GDD stages appear as plotbands on the Y-axis as before.

To build such a chart: Navigate to Weather topic, select a location and year.  Make sure to select a specific crop (not ‘Non-crop-specific weather’), the appropriate months, the WMO GSOD source and either Accum GDD or Accum Precipitation (or both) from the variables dropdown under the ‘Crop specific variables’ header.  If using a Monthly temporal period, make sure the Temporal Format is ‘Month separated from year’.  If using a Weekly temporal period, make sure to use the Temporal Format ‘Week Ending Date (approx) separated from year.

Posted in Uncategorized | Leave a comment

Removing Map Labels

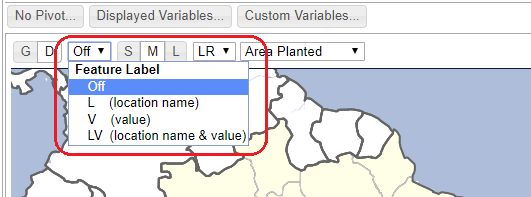
The option to choose what value is used to label features on maps has been revised into a dropdown list.  Also, an “Off” option has been added which, if selected, removes all labels from the map.

Posted in Uncategorized | Leave a comment

New Feature: Duplicate widget on same dashboard

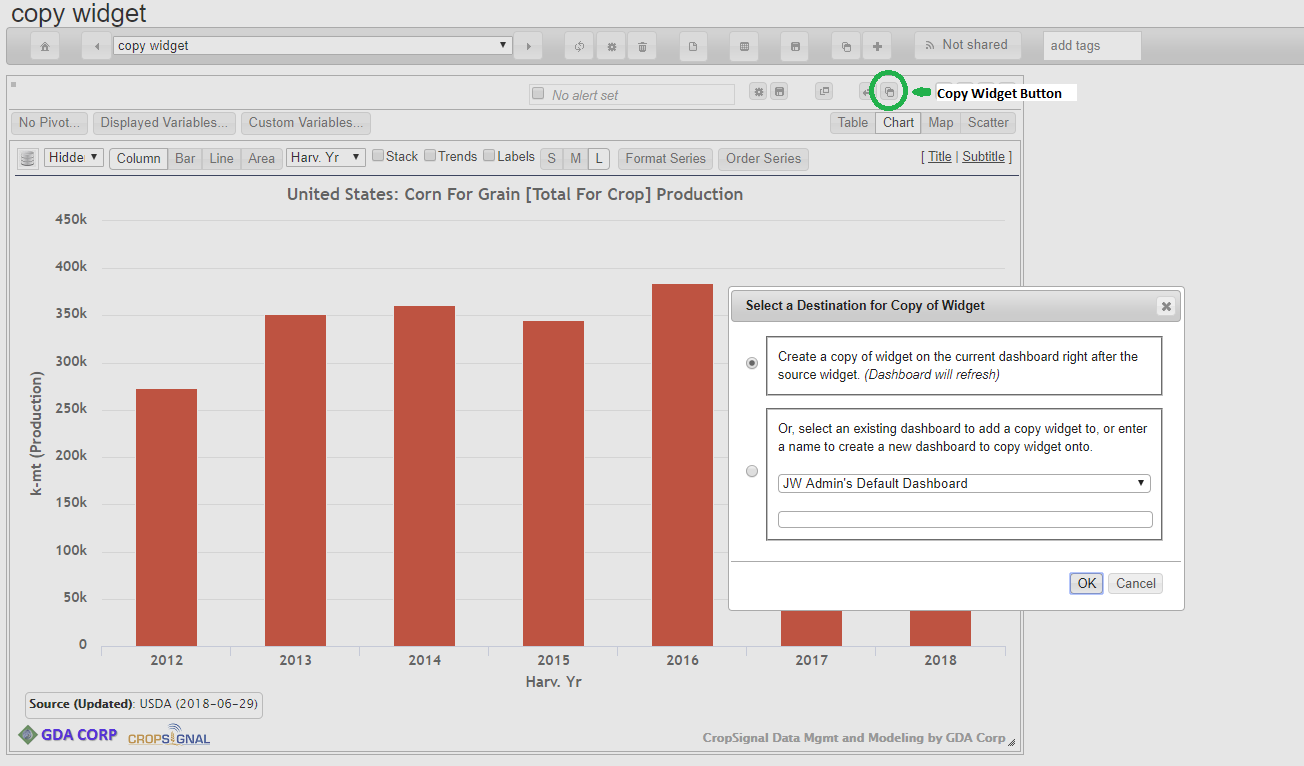
The copy widget function on the dashboard view page has been expanded to allow widgets to be duplicated on the current dashboard (in addition to copying onto another dashboard that already existed).

To duplicate a widget, click the “Copy widget” button on the widget toolbar (see green circle in screenshot).  The dialog box now has a an option to duplicate it on the current dashboard, or to select another dashboard (or create new dashboard) to copy onto.

If you select to copy on the existing dashboard, the copy will appear right after the source widget.  The dashboard will reload.

Posted in Uncategorized | Leave a comment

Data Labels Setting for Pivot Charts

You can now globally enable data labels (show each point’s data value on chart) for all series on the chart with a single setting.  The toggle setting is named “Labels” and appears in the chart toolbar.

Posted in Uncategorized | Leave a comment

Pivot Table Sorting Now Preserved

Column sorting changes on pivot tables are now preserved in the widget settings on CropSignal.  (Previously, changes to sorting weren’t preserved).  This is helpful for exporting PNG renderings of widgets with custom column sorting.

You can change the column sorting by clicking on the column header of the column you’d like to sort.  Click again to change the sort order from ascending to descending or vice versa.

Hold the shift key while clicking column titles to perform multi-column sorts.

Posted in Uncategorized | Leave a comment

CHIRPS Accumulated Precipitation variables now available

GDA is pleased to announce that new variables representing accumulated precipitation from the CHIRPS data source are now available under the Weather Topic.  These new variables take the precipitation statistics that are subset to administrative unit locations and represent different temporal periods such as dekad, month and 2 and 3 month rolling, and accumulates them over 12 month periods beginning at a given month.  Twelve new variables are added, one for each beginning month (matching the accumulated variables that were already available for WMO GSOD data).

Posted in Uncategorized | Leave a comment

Weather Topic – New temporal formats and split

We have expanded the Weather Topic so that users can choose the type of temporal format to be used in a widget.  Previously, only the full start date of the period (dekad, week, month) could be selected in YYYY-MM-DD format (this is still the supported default and existing dashboard widgets will not be effected).  This format allows data to be charted sequentially in temporal format, e.g. this screenshot.

However, this format will not allow you to make easy year-over-year comparisons.  To that end, we have added a “Temporal Format” dropdown in the topic settings (similar to that on the Annual Crop Stats topic), that allows you to choose a format that doesn’t include the year which makes year-over-year charts feasible, e.g. this screenshot.

By default, the data will be displayed over a calendar year x-axis from January to December.  However, depending on the data and locations being charted, it may be better to adjust the x-axis to start on a different date on the chart.  For this, we have added a dropdown on the chart widget toolbar that allows you to pick the date to begin the x-axis, e.g. this screenshot.

Posted in Uncategorized | Leave a comment

New Help items

New tutorials demonstrating 1) how to set up an alert to monitor data source(s) for changes and 2) how to build a chart to visualize data source forecast performance over time have been added to the Help.  You can find them listed under the PDF section on the Help section.

Posted in Uncategorized | Leave a comment