Large label sizes in maps and charts now available

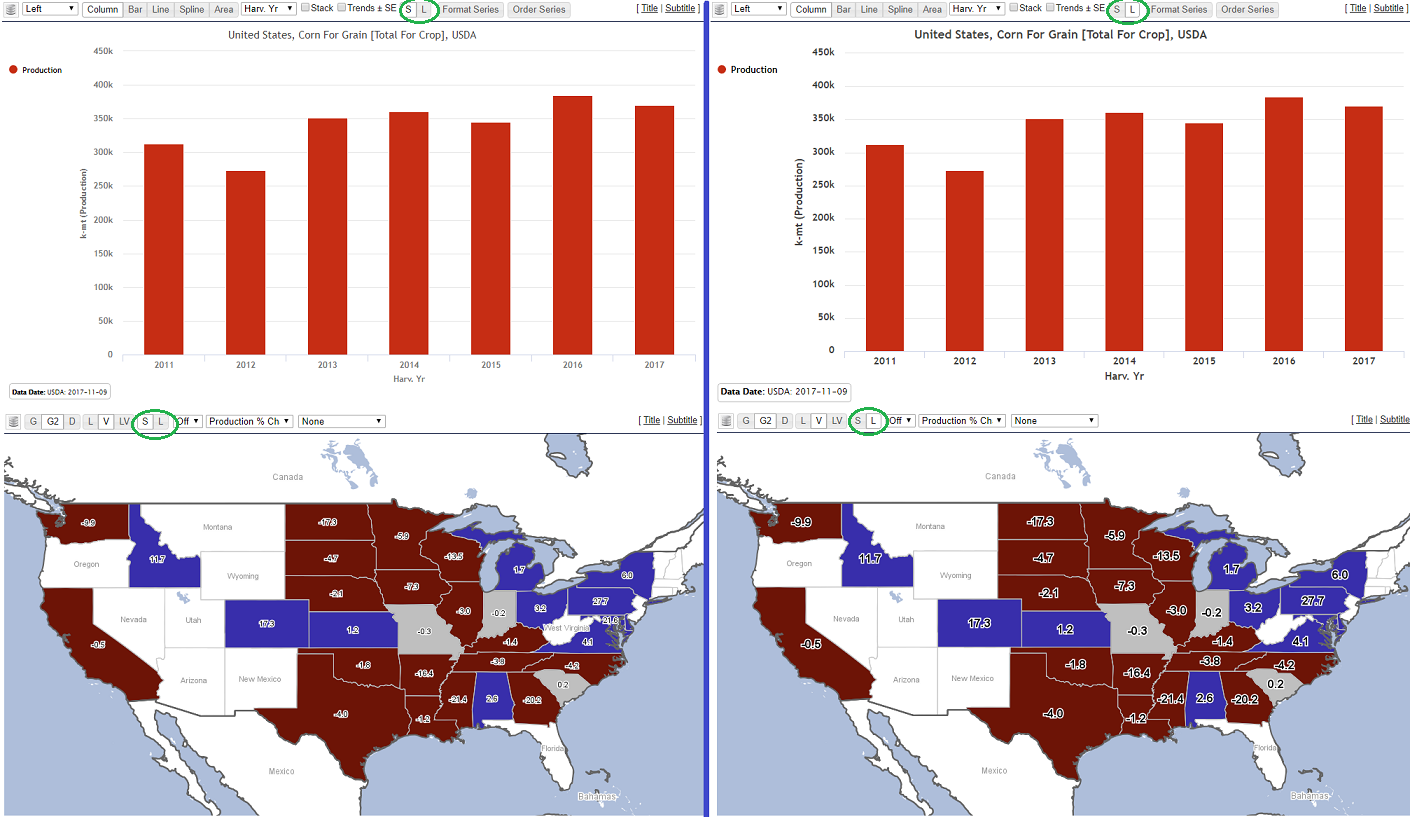
You can now elect for a widget to show its labels and/or titles in larger and bolder fonts.  A new <S, L> radio toggle button has been added to corresponding map/chart widget control bars.  The S (small) button is default and shows the font sizes the same as they have been.  The L (large) button allows you to increase the font sizes to a larger and bolder form that may be more suitable for printing.  Note that increased label sizes for chart axes and map labels may result in fewer labels being visible (due to less space), but you can adjust by increasing the width and height of the widget.

Posted in Uncategorized | Leave a comment

Crop-specific Growing Degree Day data available

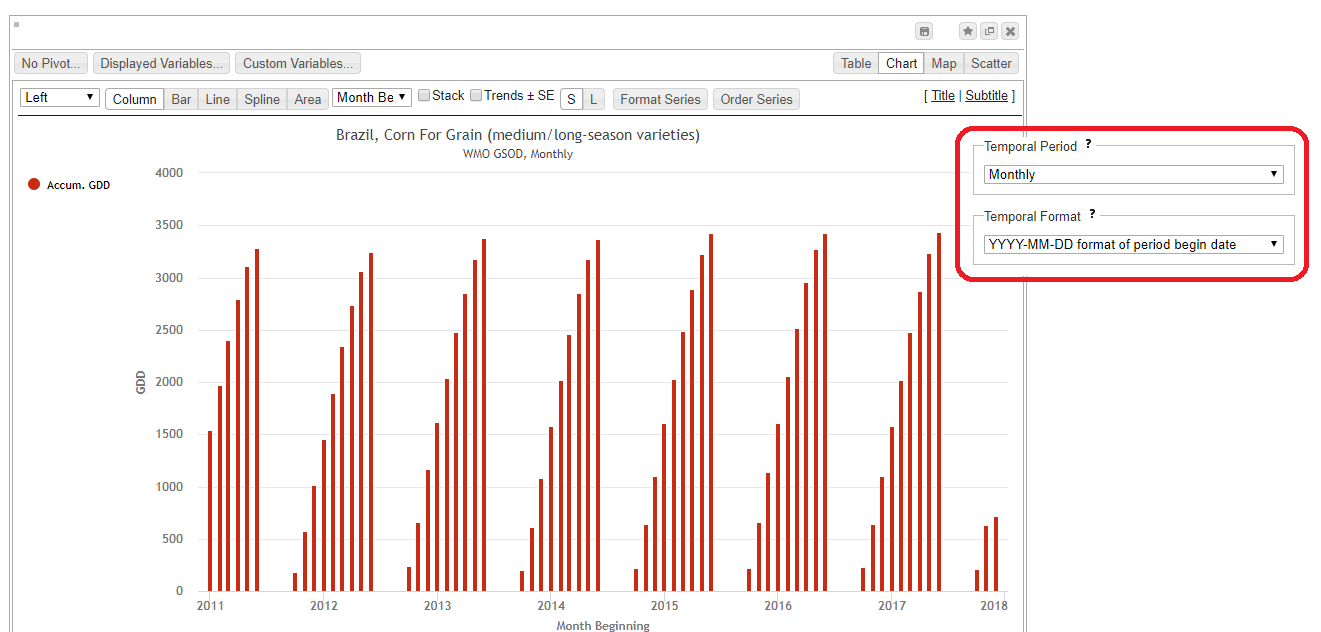
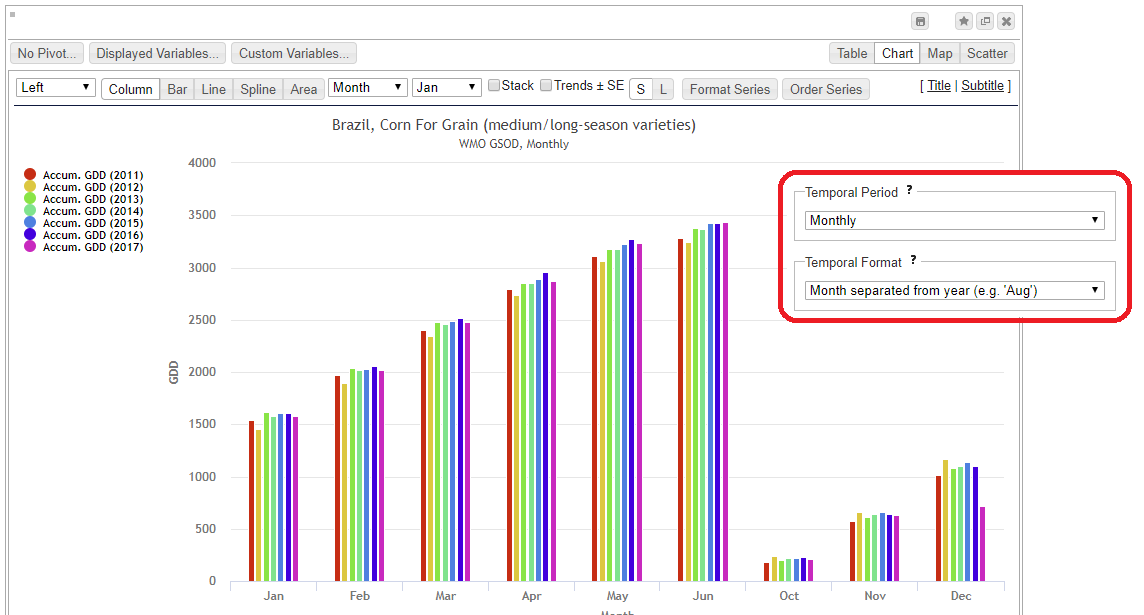
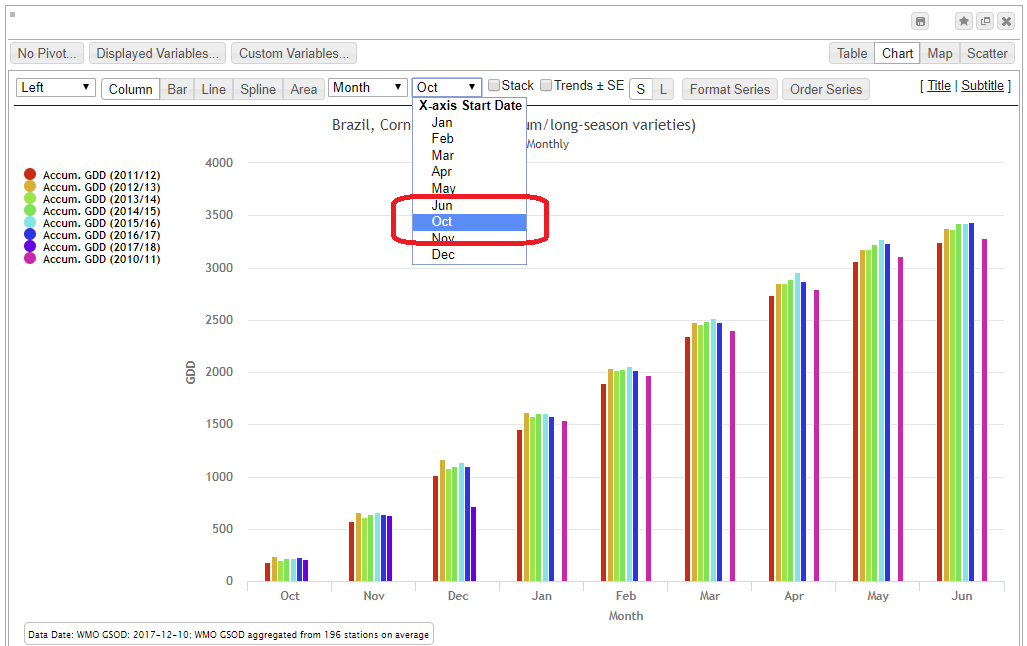
GDA has completed implementation and processing of crop-specific accumulated Growing Degree Day calculations (weekly and monthly). This dataset utilizes the WMO Global Summary of Data weather station dataset to retrieve raw daily temperature min and max values. For each supported crop, a formula is utilized for calculating the daily growing-degree-day calculation and it is added to the running accumulated totals for each administrative unit. The beginning and end date for when the GDD is accumulated is derived from the SAGE crop calendar dataset for international locations, and USDA NASS typical planting/harvest dates for locations in the US. Additionally, weather station results were only included for those contained within the SPAM2005 V3R1 (and others) crop maps so that only readings relevant to the crop are included. Processing was completed for L1 (country) to L4 administrative locations, provided that raw temperature data is available from WMO that meets the spatial criteria from SPAM and is within the temporal periods identified by SAGE and NASS. Whenever possible, crop varieties are provided. Additionally, crop stage information is provided in the pivot table. Crop Stages are based on the crop type and the accumulated GDD value of the period.

The following crops have been implemented:
Barley (Spring)
Canola
Corn For Grain
Cotton Lint All
Millet All
Peanuts in Shell All
Rice All
Sorghum For Grain
Soybeans
Sugar Beet All
Sunflower Seed All
Wheat Spring
Wheat Winter

The GDD can be found in CropSignal’s Weather topic – as long as a crop type is available under the Crops drop-down, you can select WMO GDD or Accumulated GDD results.

Note that this data is distinguished from the standard non-crop-specific GDD_10 (base 10 degrees Celsius) and aggregated non-crop-specific GDD_10 variables that are available if “Non-crop-specific weather” is selected from the dropdown.

Posted in Uncategorized | Leave a comment

New map classifier for percent change variables; standardized map unit labels

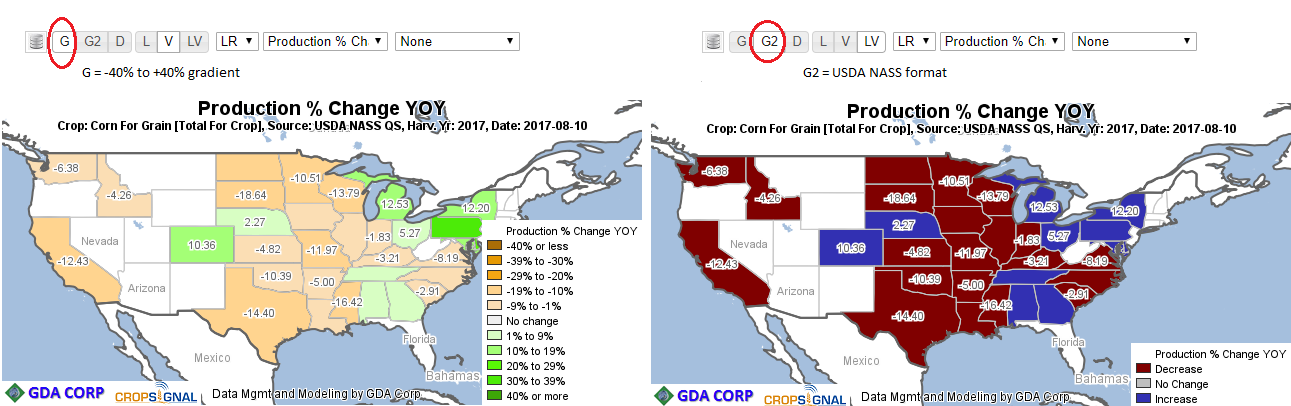
A new “G2” global map classifier is now available when mapping percent change variables.  The main “G” global classifier shows a gradient brown-to-green classifier with 11 classes from -40% to +40%.  The second “G2” global classifier uses the USDA NASS 3-class classifier that just shows positive change, negative change and no change.  Additionally, we’ve standardized the value labels on the Annual and Monthly Crop Stats topics so that all mapped locations show their values in the same unit system (which the user can configure in the units sections on the Topic settings, which default to k-ha, k-mt, mt/ha, etc).

Posted in Uncategorized | Leave a comment

Deprecated SeasonalAnalysis Widget repaired

Due to constant updates to our topics, some of the older deprecated pre-pivot widgets on the SeasonalAnalysis topic were no longer rendering correctly.  This has been fixed and they should appear correctly now.  We do encourage replacing these widgets with pivot-based versions, since they are still considered deprecated.

Posted in Uncategorized | Leave a comment

New Report Date Format on Annual Crop Stats Topic

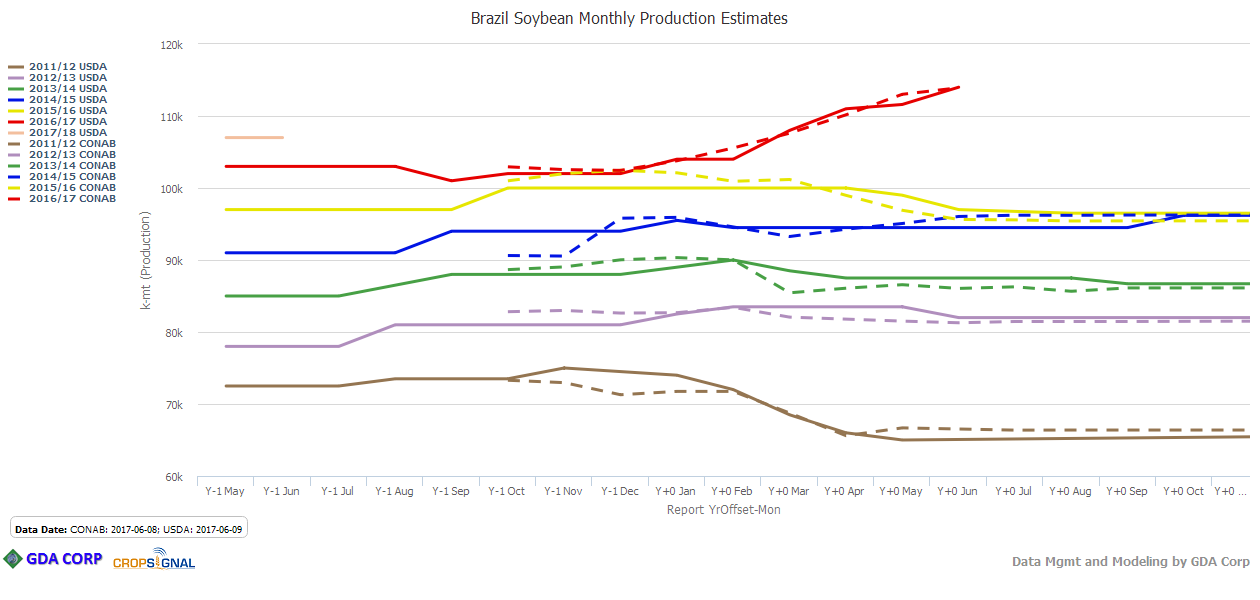
We have added a new available date format for report dates in the Annual Crop Stats Topic.  This format combines the month of release with the offset (or difference) between the calendar year of the report date and the production year of the statistic.  This allows one to look at forecasted estimates over time for multiple years, even if the forecasted estimates span more than one calendar year.  This new format is listed as ‘Forecast Year Offset-Month’ in Annual Crop Stats.  See the example below comparing CONAB and USDA forecasts for Brazil Soybeans, the forecasts of which span multiple years.

Posted in Uncategorized | Leave a comment

Coceral statistics now available

Statistics from the latest Grains and Oilseeds reports from Coceral (www.coceral.com) are now available under the Annual Crop Stats topic.

Posted in Uncategorized | Leave a comment

Pakistan Central Cotton Committee Reports & Statistics now available

The target, assessment and area sown statistics from the Pakistan Central Cotton Committee reports are now available.  The target and assessment area and production values can be found in the Annual Crop Stats Topic, while the Area Sown progress values are available in the Seasonal Analysis Topic under Crop Progress.  The PDF reports are also available under the Reports Topic.

Posted in Uncategorized | Leave a comment

New Australia Reports

PDF reports from PIRSA and GIWA are now indexed in our Reports topic.

Posted in Uncategorized | Leave a comment

New CHIRPS SPI drought classification variables

To the aggregated CHIRPS weather data under the Weather Topic, we have added new variable calculations that show the percent of cropland pixels whose aggregated SPI falls into each item of a set of drought conditions for each administrative unit location and temporal period.

  • >= 1.5
  •  0.5 to 1.5
  • Average (SPI -0.5 to 0.5)
  • D0 – Abnormally Dry (SPI -0.5 to -0.7)
  • D1 – Moderate Drought (SPI -0.8 to -1.2)
  • D2 – Severe Drought (SPI -1.3 to -1.5)
  • D3 – Extreme Drought (SPI -1.6 to -1.9)
  • D4 – Exceptional Drought (SPI <= -2.0)
Posted in Uncategorized | Leave a comment

Mexican SIAP statistics available!

Annual crop statistics and crop progress from Mexican SIAP organization are now available.  This rich dataset provides data for all four administrative unit locations (National, State, District and Municipality) for 1980 to 2016 (annual stats) as well as progress data from 2004 to 2017.  Look for the “SIAP” source in the Annual Crop Stats topic as well as the Crop Progress section in the Seasonal Analysis topic.

Posted in Uncategorized | Leave a comment